
Last weekend, I was in deep though. My question is simple: Why do some shares fly sky high even without any fundamental while others just sitting around?
I was refering to Pantai, Sugar, Ramunia....just to name a few. All my technical analysis (MACD, candlestick, RSI, EMA) didn't indicate or predict that a counter that moves up will generate either 100% return or falls back to square one.
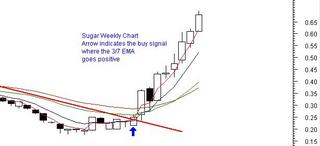
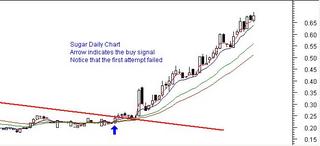
So I kept searching for the elusive answer. Well, I think I have found it. The answer lies in the simple Exponential Moving Average of value 3, 7, 20 and 30. Why these value? Well the value 3 & 7 was suggested by my futures broker. Using only these two generate to many false signals (no wonder I lost heavily in futures) A forummer suggested the importance of the value 30 (can't remember his name) and I added the final value 20 to filtered out the weak signals. So take out your technical analysis tool. Plot the chart for these, put it in a different colour and see for yourself.
Did you notice anything common about Ramunia, Sugar, Pantai...and now RHB? Well, if the daily 3/7/20/30 EMA crosses to positive (that means moving up), then check the weekly chart which should shows the weekly 3/7 EMA also crosses positive. Well, if you find this pattern, then look at the daily and weekly MACD. Both should be positive or going positive. And with these patterns, with high probability, it will go up. But the trick is to look how many attempts it is doing this. Usually, the first try will fail. It will fall back down a little bit. But if it just stop short of the previous low and continue to move up, then you may have a good winner. It will rally up at least 50%. The trend may last for 6 months earning you 100% or more.
So what you waiting? Get those charts. I have discovered a few: RHB, UBS, Landmarks and Picorp. If you found more, please do message me. I am trying to figure out how to use the Metastock search function to find these patterns.
Good luck!
No comments:
Post a Comment