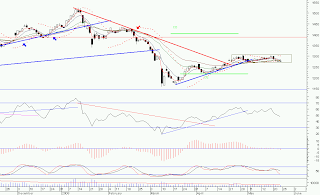
 KLCI Daily Chart
A double top? Or an oscillation between 1280 to 1305? A breakdown will be ugly. Which I think that this is the greater probability as all daily indicators are bearish.
 KLCI Weekly Chart
A break down may mean that a revisit of 1150 and maybe 1000. The later is still too early to tell.
So watch out!
No comments:
Post a Comment