Ads

Saturday, September 24, 2005

MTDInfr-WA


Weekly RSI has hit a new high at 64. I’m expecting more upside. No plans yet to add in more position.

My entry: 0.285, 0.32 and 0.345

Mems


Not yet time to move up. This is another so-called good Mesdaq counter. The floor looks like infested with anai-anai.

My entry: None

GHLSys


I suffer a lot with this counter, bought at 0.60(pre-BI)/0.38/0.33/0.21 and it is still dropping. Lesson learned: study technical analysis to time your buying even though it is fundamentally good. I sold off my right issues, as I see no point of adding in more position until the stock shows signs of reversing. Never catch a falling knife and beware of the unseen anai-anai. And also remember to cut lost when the odds are against you!

My entry: 0.60(pre-BI)/0.38/0.33/0.21

Thursday, September 22, 2005

Mistakes

Sold a few counters with loss: Plus-CA, Quest, Sumatec as they do not exhibit the bull patterns that I'm looking for. However, Quest later shows some signs of developing into a winner (or maybe a rebound). It's still too soon to tell. I have used the money to buy other counters.

Another mistake is that I add too soon my position on RHB. Should have waited longer.

I'm still following Carotec, RHB, Oskvi and Mtdinfr-WA. Will sell/buy when there is signal.

Tuesday, September 20, 2005

Fear and Greed

RHB is in consolidating mode. I was tempted to lock it part of my profit in the morning. But greed stop me from doing it. As the price keeps drooping, I then fear the lost of my profit. Yes, in stock market, everyone is rule by greed and fear. Only the best are void of emotion. Anyhow, I did nothing today. Too busy with work and no time to monitor the market.

Only after the close of the market I can analyse logically my situation. Here are my analysis:
RHB: Moved up to much too fast, profit taking activity for 2 days already. Support should kick in at around 0.82 region.
MTDInfr-WA: Also too fast too much. The moving average needs to do some catch up before more up trust. I will only add into my position if it can move above 0.40. My only concern is that MTDInfr may be taking a rest after the short sprint.
Carotech: Movement linked to Hovid. This one U-turn very fast. I was not able to buy near the closing as I was busy with work. Will try to catch some tomorrow.

Sunday, September 18, 2005

Carotech


Wave 1 has terminated at 0.52. I am waiting for the end of correction to buy.

My entry: 0.395

Saturday, September 17, 2005

MTDInfra


From the weekly chart, MTDInfra should be reaching its wave 3 target of 1.23 soon. Very strong buying just before Friday’s close. MTD must be buying aggressively just before the capital repayment of 20 cents (the entitlement date has not been announce yet). The weird thing is that MTDInfra-wa is not moving as it is supposed to be. The warrant exercise price is 0.80 while the maturity date is 27 Jun 2007. At Friday’s closing price, 0.32 + 0.80 = 1.12 which is 8 cents lower than the MTDInfra price. The first target for MTDInfra-wa is 0.40 if the resistance of 0.335 is broken. I will buy more when this level is broken.

My entry: 0.285, 0.32

RHB


I’m still holding my RHB. I thought there would be a correction right after last Thursday long shadow hammer, but the buying strength was great. The minimum target of 0.85 has been breached. If it still keeps going up, then my Fibonacci target will be 1.22 for wave 3. The daily and weekly charts all show an overbought condition. So, I will only try to get more after the correction (if any).

My entry: 0.595, 0.645 and 0.715

Friday, September 16, 2005

Weekly Analysis


Weekly Chart: Weekly MACD turns negative! While weekly EMA still negative. Now the negative MACD worries me. I have gone through the chart and history shows that when it turns negative, more downward move is going to happen.

Daily Chart: Downtrend channel broken in daily chart. Daily EMA lines show that they probably won't converge and diverge! If they don't do this, then my analysis shows that any up move will not be strong. Daily RSI is slightly below 60. However daily MACD is positive.

Conclusion: Patriotic fund managers are pushing up the index for Hari Malaysia. Any up move will not be strong as the weekly MACD is contradicting with the daily MACD. Maybe a correction first for the next strong move.

Now, my Elliot Wave knowledge is not that good. But IF I am correct, we may see the end of wave 2 and more agressive wave 3 selling. Maybe I'm wrong kua.

Disclaimer: This is a non-professional opinion only, please do your own analysis before making any decision.

Thursday, September 15, 2005

Riding the wave!

I'm on RHB wave, entered at 0.595, 0.645 and 0.715 in 3 consecutive days. Just play small small only. My analysis says RHB is in wave 3.

I'm also in OSKVI at 0.135. Wave 3 not yet move.

Looking for possible entry at MTDInfra. This one puzzles me, the mother is moving but not the son.

Hovid is moving, so is Carotec. I was in Carotec long time ago before I got "enlightenment". Looks like it is in wave 1 only. Wait for correction for the super-duper wave 3.

Landmarks moved today. I was not it.

KNM, Sugar and Pantai rallied quite a lot already. I feel uncomfortable to chase them.

UBS, Affin and Puncak should be moving soon kua.

Tuesday, September 13, 2005

Eureka (Part 2)

Okie, based on the new patterns that I found, I have categorize the following:

Bulls in progress: KNM, Sugar, Pantai
Young Bulls: RHB, Landmarks, UBS
Maybe Bulls in creation: Puncak, OSKVI, Affin

If you want to buy, good luck to you. Just remember that nothing is 100% certain.

Eureka!


Last weekend, I was in deep though. My question is simple: Why do some shares fly sky high even without any fundamental while others just sitting around?

I was refering to Pantai, Sugar, Ramunia....just to name a few. All my technical analysis (MACD, candlestick, RSI, EMA) didn't indicate or predict that a counter that moves up will generate either 100% return or falls back to square one.

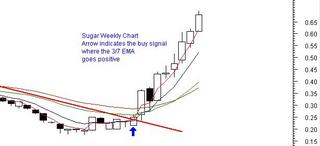
So I kept searching for the elusive answer. Well, I think I have found it. The answer lies in the simple Exponential Moving Average of value 3, 7, 20 and 30. Why these value? Well the value 3 & 7 was suggested by my futures broker. Using only these two generate to many false signals (no wonder I lost heavily in futures) A forummer suggested the importance of the value 30 (can't remember his name) and I added the final value 20 to filtered out the weak signals. So take out your technical analysis tool. Plot the chart for these, put it in a different colour and see for yourself.

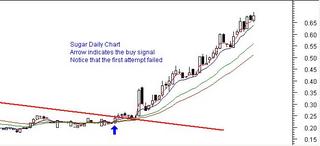
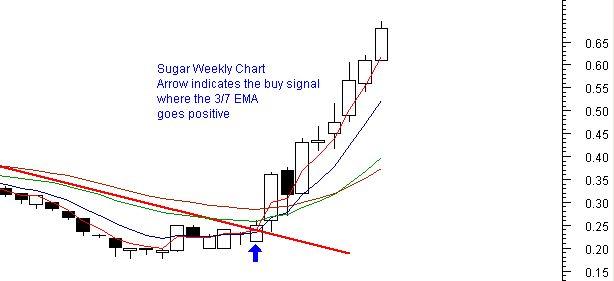
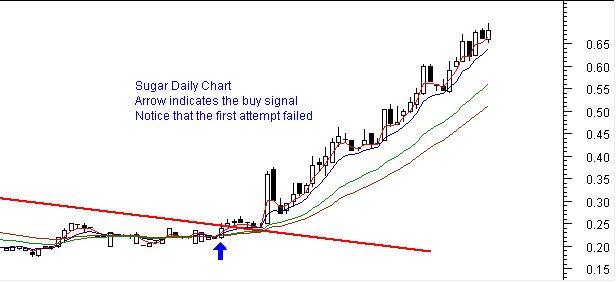
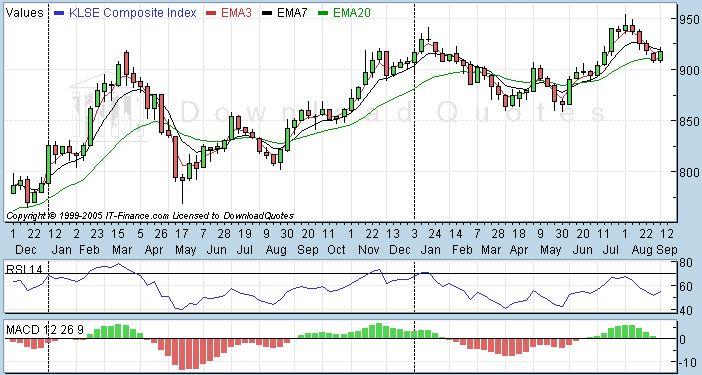
Did you notice anything common about Ramunia, Sugar, Pantai...and now RHB? Well, if the daily 3/7/20/30 EMA crosses to positive (that means moving up), then check the weekly chart which should shows the weekly 3/7 EMA also crosses positive. Well, if you find this pattern, then look at the daily and weekly MACD. Both should be positive or going positive. And with these patterns, with high probability, it will go up. But the trick is to look how many attempts it is doing this. Usually, the first try will fail. It will fall back down a little bit. But if it just stop short of the previous low and continue to move up, then you may have a good winner. It will rally up at least 50%. The trend may last for 6 months earning you 100% or more.

So what you waiting? Get those charts. I have discovered a few: RHB, UBS, Landmarks and Picorp. If you found more, please do message me. I am trying to figure out how to use the Metastock search function to find these patterns.

Good luck!

Monday, September 12, 2005

Weekly Analysis


I will try to give my opinion based on my knowledge of technical analysis. I'm not sure how the image will turn out when uploaded. I will base my reading on the weekly chart as it will give an indication of the long term trend.

The MACD shows that this is an uptrend, but as it is reducing, that means we are in consolidation mode. If it keeps reducing, then we are in the BEAR mode. Last week, a white candle was made on the chart giving a bullish engulfing candle. This usually indicates the change of trend (going up?) The RSI curve up at 50. Another good sign. With DJI rallying last week, I think that it will go up some more. Target about 960???

Thursday, September 08, 2005

Up up .....and away?

It finally came, the rebound. Oil drop with the release of 80 million barrels from the reserves. The index moved so much, many counters also move up, but mine are all staying put. So why? Is this just plain bad luck or bad choice of counters?

Anyway.....I have decided to not to monitor the counters too much....it puts in too much emotion into my decision. I will base my decision on daily charts. That will be enough.

From the weekly chart, KLCI is still in bull and possibly in wave 5 (based on Elliot) Target should be higher than 960.

So, got more bullets? My last one was spent on Sunrise (read the recommendation by investsmart). Now I will have to get more bullets for mtdinfra-wa. Looks like mtdinfra going to break new high. mtdinfra-wa exercise price is only 0.80, when mtdinfra implements the capital repayment, it will be adjusted to 0.60. So, mtdinfra is in the money and mtdinfra-wa is trading almost without premium.

Saturday, September 03, 2005

Desperate for a Rebound!

The index ends under 910 for this week. Yes, I know I said that support is 910, but I'm not God. I can't determine the exact support. Nobody cans. But the probability is higher here. Expects gives a range of 900-910. Everyone one is just guessing.

So where is the rebound? Or change of trend? Stochastic oversold. RSI oversold. MACD show some sign of bullish divergence. So there is hope. Yes, when everyone feel desperate, that's the point where the market will turn around.

So are you feeling hopeless? Then buy.......