 Digi Weekly Chart
Announced MYR0.50 dividend, ex-date on 11 Nov 2010. Since the announcement date, the price has moved 60 cents. Based on the chart, it should challenge the all time high of 27.50.
Disclosure: No position
Digi Weekly Chart KLCI Daily Chart
| Malaysia | Monthly | Weekly | Daily |
| FBM KLCI | Up | Up | Up |
| Finance | Up | Up | Up |
| Construction | Up | Up | Up |
| Plantation | Up | Up | Up |
| Property | Up | Up | Up |
| New Warrants | Expiration | Type | Ex Price | Ratio | Call Price |
| BJTOTO-JA | 28/07/2011 | Bull | MYR 3.6500 | 4 : 1 | MYR 3.8000 |
| WCT-CC | 28/10/2011 | Call | MYR 3.2000 | 4 : 1 | |
| AFFIN-CD | 28/10/2011 | Call | MYR 3.0000 | 4 : 1 | |
| YTLPOWR-CB | 28/10/2011 | Call | MYR 2.1500 | 2 : 1 | |
| AIRASIA-CJ | 28/10/2011 | Call | MYR 2.3500 | 3 : 1 | |
| GLD-C3 | 27/06/2011 | Call | USD 125.0000 | 350 : 1 | |
| AIA-C1 | 27/06/2011 | Call | HKD 18.0000 | 6 : 1 | |
| MMCCORP-CC | 27/06/2011 | Call | MYR 2.9000 | 3 : 1 | |
| MAYBANK-CP | 27/06/2011 | Call | MYR 8.5000 | 7 : 1 |
| New Warrants | Expiration | Type | Ex Price | Ratio |
| QSR-CA | 18/08/2011 | Call | MYR 5.1500 | 6 : 1 |
| WCT-CB | 18/08/2011 | Call | MYR 3.1000 | 4 : 1 |
| GLD-C2 | 18/08/2011 | Call | USD 130.0000 | 380 : 1 |
| APPLE-C3 | 18/08/2011 | Call | USD 300.0000 | 1350 : 1 |
| Malaysia | Monthly | Weekly | Daily |
| FBM KLCI | Up | Up | Up |
| Finance | Up | Up | Up |
| Construction | Up | Up | Up |
| Plantation | Up | Up | Up |
| Property | Up | Up | Up |

| Date | MYR (billion) | USD (billion) |
| 30-Sep-10 | 310.8 | 100.7 |
| 15-Oct-10 | 322.7 | 104.6 |
| New Warrants | Expiration | Type | Ex Price | Ratio | Call Price |
| MAXIS-JA | 21/07/2011 | Bull | MYR 4.7500 | 5 : 1 | MYR 4.9500 |
| MPHB-JA | 21/07/2011 | Bull | MYR 1.8000 | 3 : 1 | MYR 1.9000 |
| UMW-CD | 21/10/2011 | Call | MYR 6.5000 | 5 : 1 |
 KLCI Daily Chart
| Malaysia | Monthly | Weekly | Daily |
| FBM KLCI | Up | Up | Up |
| Finance | Up | Up | Up |
| Construction | Up | Up | Up |
| Plantation | Up | Up | Up |
| Property | Up | Up | Up |
| New Warrants | Expiration | Type | Ex Price | Ratio |
| DRBHCOM-CC | 18/10/2011 | Call | MYR 1.1500 | 2 : 1 |
| KLK-CJ | 18/10/2011 | Call | MYR 17.0000 | 20 : 1 |
| MMCCORP-CB | 18/10/2011 | Call | MYR 3.1500 | 4 : 1 |
| MRCB-CE | 18/10/2011 | Call | MYR 2.1000 | 3 : 1 |
 Wow! So many people oil there believed in peak oil. That is a good sign. I hope that those that believe in peak oil are well prepared for the future.
| New Warrants | Expiration | Type | Ex Price | Ratio | Call Price |
| GAMUDA-CN | 11/10/2011 | Call | MYR 3.8800 | 5 : 1 | |
| SAPCRES-CC | 11/10/2011 | Call | MYR 2.4000 | 3 : 1 | |
| MAYBANK-JA | 11/10/2011 | Bull | MYR 7.0400 | 10 : 1 | MYR 7.4800 |
| PBBANK-JA | 11/10/2011 | Bull | MYR 10.0500 | 15 : 1 | MYR 10.6800 |
| New Warrants | Expiration | Type | Ex Price | Ratio |
| DRBHCOM-CB | 7/10/2011 | Call | MYR 1.2900 | 1 : 1 |
| TCHONG-CE | 7/10/2011 | Call | MYR 5.6000 | 8 : 1 |
| TOPGLOV-CD | 7/10/2011 | Call | MYR 5.3000 | 10 : 1 |
| GENS-CC | 7/10/2011 | Call | SGD 1.9500 | 8 : 1 |
| GENHK-C2 | 7/10/2011 | Call | USD 0.4500 | 3 : 1 |
| SLV-C1 | 7/10/2011 | Call | USD 20.5000 | 90 : 1 |
| World | Monthly | Weekly | Daily |
| S&P500 | Up | Up | Up |
| DJI | Up | Up | Up |
| NasdaqComp | Up | Up | Up |
| Nikkei 225 | Down | Neutral | Up (+) |
| Kospi | Up | Up | Up |
| SSECI | Down | Neutral | Up (+) |
| HSI | Up | Up | Up |
| TWII | Up | Up | Up |
| STI | Up | Up | Up |
| JKSE | Up | Up | Up |
| SENSEX | Up | Up | Up |
| AORD | Up | Up | Up (+) |
| NZX50 | Up | Up | Up (+) |
| FTSE | Up | Up | Up |
| DAX | Up | Up | Up (+) |
| RTSI | Up | Up | Up |
| Bovespa | Up | Up | Up |
| Malaysia | Monthly | Weekly | Daily |
| FBM KLCI | Up | Up | Up |
| Finance | Up | Up | Up |
| Construction | Up | Up | Up |
| Plantation | Up | Up | Up |
| Property | Up | Up | Up |
 WTI Crude Oil Weekly Chart
| New Warrants | Expiration | Type | Ex Price | Ratio | Call Price |
| PROTON-CF | 4/10/2011 | Call | MYR 4.8000 | 5 : 1 | |
| GENTING-CV | 4/10/2011 | Call | MYR 9.8000 | 12 : 1 | |
| TENAGA-CR | 4/10/2011 | Call | MYR 9.0000 | 6 : 1 | |
| GENM-JA | 4/10/2011 | Bull | MYR 2.5500 | 5 : 1 | MYR 2.7000 |
| GENHK-C1 | 4/10/2011 | Call | USD 0.5000 | 3 : 1 |
| World | Monthly | Weekly | Daily |
| S&P500 | Up (+) | Up | Up |
| DJI | Up (+) | Up | Up |
| NasdaqComp | Up (+) | Up | Up |
| Nikkei 225 | Down | Neutral | Neutral (-) |
| Kospi | Up | Up | Up |
| SSECI | Down | Neutral (+) | Neutral |
| HSI | Up | Up | Up |
| TWII | Up | Up | Up |
| STI | Up | Up | Up |
| JKSE | Up | Up | Up |
| SENSEX | Up | Up | Up |
| AORD | Up (+) | Up | Neutral (-) |
| NZX50 | Up (+) | Up | Neutral (-) |
| FTSE | Up (+) | Up | Up |
| DAX | Up | Up | Neutral (-) |
| RTSI | Up | Up | Up |
| Bovespa | Up | Up | Up |
 KLCI Weekly Chart
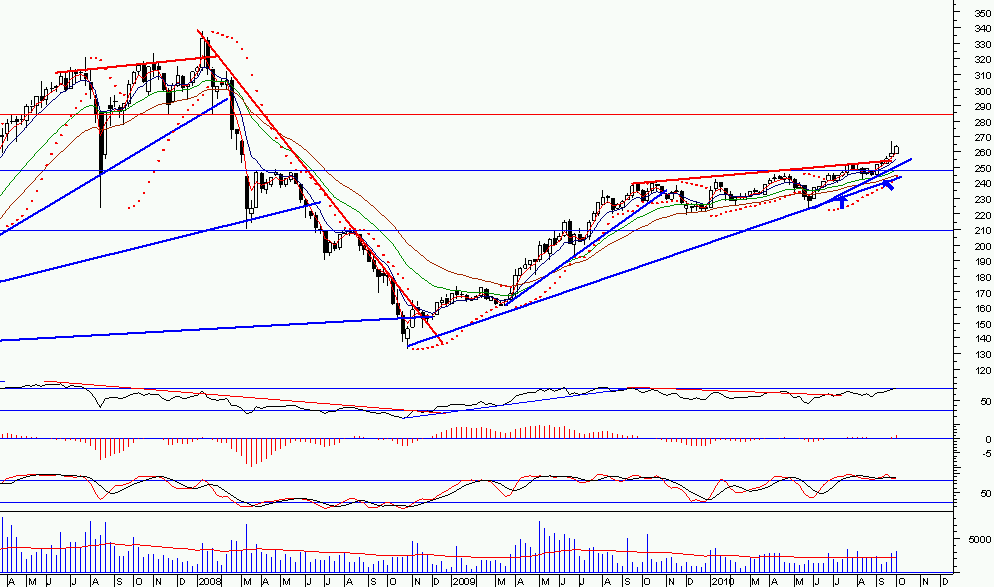 Construction Sector Weekly Chart
| Malaysia | Monthly | Weekly | Daily |
| FBM KLCI | Up | Up | Up (+) |
| Finance | Up | Up | Up (+) |
| Construction | Up | Up | Up |
| Plantation | Up | Up | Up (+) |
| Property | Up | Up | Up |
