Ads

Friday, October 30, 2009

Weekly Summary

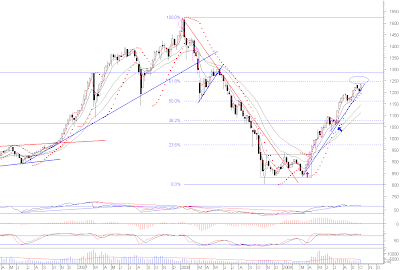
FBM KLCI Monthly Chart

Another up month. Monthly RSI and Stochastic indicates that the market can still go up as it is still not yet overbought.

FBM KLCI Weekly Chart

However, looking at the weekly chart, I see a possible break of uptrend line! For me, this means that it is not a time to buy. No solid sell signal yet. Correction still in progress. For the uptrend to continue, KLCI must consolidate between 1220 - 1250.

For the rest of the sectors, I see weakness but am not alarmed yet.

Malaysia Monthly Weekly Daily Note
FBM KLCI Up Up Neutral (-) R=1.3k, S=1.2k. Correction
Finance Up Up Neutral (-) R=11k, S=9.5k. Correction
Construction Up Up Neutral (-) R=250, S=220
Plantation Up Up Neutral (-) R=6.15k, S=5.8k
Property Up Up Neutral (-) R=820, S=760

Tuesday, October 27, 2009

Weekly Summary (late)

Sorry for posting this late. I was away on a vacation. Very tired now after walking the whole day for 4 straight days. I took a vacation to cure my work fatigue. But now, I need a vacation to cure my vacation fatigue!

No charts, just the tables of summary. This is for Bursa Malaysia (23 Oct 2009):
Malaysia Monthly Weekly Daily Note
FBM KLCI Up Up Up R=1.3k, S=1.15k. Overbought
Finance Up Up Up R=11k, S=9.5k. Overbought
Construction Up Up Up R=250, S=220
Plantation Up Up Up R=6.15k, S=5.8k
Property Up Up Up R=820, S=760

For the rest world (23 Oct 2009):
World Monthly Weekly Daily Note
S&P500 Up Up Neutral (-) R=1.12k, S=1.01k
DJI Up Up Up R=10.1k.
NasdaqComp Up Up Up R=2.18k
Nikkei 225 Up Up (+) Up (+) Next R=11k
Kospi Up Up Neutral R=1.9k.
SSECI Up Up (+) Up (+) R=3.5k. S=2.6k. Finding base.
HSI Up Up Up R=23.5k, S=20k.
TWII Up Up Neutral (-) R=7.9k. S=7k
STI Up Up Up R=2.7k. S-2.52k
JKSE Up Up Up R=2.5k. S=2.3k
SENSEX Up Up Neutral (-) R=17.6k
AORD Up Up Up R=4.9k
NZX50 Up Up Up R=3.2k
FTSE Up Up Up R=5.4k
DAX Up Up Neutral (-) R=6.15k
RTSI Up Up Up R=1.5k
Bovespa Up Up Neutral (-) R=66k

Friday, October 23, 2009

International Reserves of BNM

Date MYR (billion) USD (billion)
30-Sep-09 334.3 96.0
15-Oct-09 334.2 95.9

Source.

Sunday, October 18, 2009

Commodity Summary

Crude Oil Futures Weekly Chart

Breakout and next resistance at 87.00. Others:
Commodity Monthly Weekly Daily
Gold Up Up Up
Crude Oil Up Up Up
Crude Palm Oil Down Down Up (+)
Rough Rice Neutral Up (+) Up (+)

World Weekly Summary

Generally, most of the markets are pointing up but it doesn't look like a strong move.

World Monthly Weekly Daily Note
S&P500 Up Up Up R=1.12k, S=1.01k
DJI Up Up Up R=10.1k.
NasdaqComp Up Up Up R=2.18k
Nikkei 225 Up Neutral Neutral Next R=11k
Kospi Up Up Neutral R=1.9k.
SSECI Up Neutral Neutral R=3.5k. S=2.6k. Finding base.
HSI Up Up Up R=23.5k, S=20k.
TWII Up Up Up R=7.9k. S=7k
STI Up Up Up (+) R=2.7k. S-2.52k
JKSE Up Up Up R=2.5k. S=2.3k
SENSEX Up Up Up (+) R=17.6k
AORD Up Up Up R=4.9k
NZX50 Up Up Up R=3.2k
FTSE Up Up Up R=5.4k
DAX Up Up Up R=6.15k
RTSI Up Up Up R=1.5k
Bovespa Up Up Up R=66k

Saturday, October 17, 2009

Weekly Summary

KLCI Weekly Chart

KLCI has surpassed the 61% retracement level. Daily and weekly chart indicates overbought (again!). I think that resistance is around 1290 to 1300.

ACE Market is now also up. That means from bluechips to penny shares are all out. Volume are higher but not at the euphoria level. Property index has broken out of a rising wedge. Since the property index daily chart is overbought, I'm expecting a pullback before more upside.

The sector summary:
Malaysia Monthly Weekly Daily Note
FBM KLCI Up Up Up R=1.3k, S=1.15k. Overbought
Finance Up Up Up R=11k, S=9.5k. Overbought
Construction Up Up Up R=250, S=220
Plantation Up Up Up R=6.15k, S=5.8k
Property Up Up Up R=820, S=760
FBM ACE Up Up (+) Up (+) Breakout fr triangle pattern.

Wednesday, October 14, 2009

Axiata

Axiata Daily Chart

Watch out on Axiata. It could resume its uptrend. No signal yet. 3 CWs are available: -CB, -CC and -CD. Premium wise, -CB is the cheapest.

Disclosure: Long in CW.

Gamuda

Gamuda Daily Chart

Gamuda is moving up with increasing volume. Watch out for a possible break of a symmetrical triangle pattern. The premium for its CWs are 3.94% (-CH, MYR0.48), 20% (-CI, MYR0.21) and 10.3% (-CJ, MYR0.16). My preference would be -CH.

Disclosure: Long in CW.

MRCB

MRCB Daily Chart

MRCB gave me the buy signal. Should challenge the upper boundary of a rising wedge. MRCB-CA is almost ATM. However, it is valued at a high premium of 25.18%. No go on the CW.

Disclosure: No position.

Tuesday, October 13, 2009

Pulling the Trigger

When I started trading, I always have problem of buying or selling. I grow nervous. All sort of questions comes into my mind. Is this a good price? Is it cheap now? Is it expensive? What happened if the price drop after I buy? etc etc. My heart will beat faster when I want to click the final "OK" button. I was full of adrenalin in trading stocks!

As time goes by, I manage to learn new tricks, new thinking to pull the trigger, like a cold blooded killer.

First thing, you must have a system that says when to buy, when to sell. You must take the signal no matter what others (economist, traders etc) say. Until you change your system due to the failure of your method, you must adhere to it.

Next, don't think about the price that you are paying. You cannot view the stock as cheap or expensive. What I do is to view the direction of the stock. There are 4 possible answers: Up, Down, Going nowhere (consolidation/bottoming/topping), I don't know.

You need to know that a stock moves like this: directionless , trending, directionless, trending, directionless, trending, .....and so on. The directionless could be just a consolidation or change of trend.

So, your trading system must be able to identify "up", "down" and "consolidation or topping or bottoming". The "I don't know" is due to insufficient data point. When you get insufficient data point, then obviously, you need to wait for a more clearer signal.

When you can think logically, then you will get rid of your emotion during the buying/selling phase. You will not second guess your action. You will become a cold blooded trader.

Cnooc and Petroch

Petroch Weekly Chart

Petroch (0857) is at the upper boundary of an ascending triangle. Watch out for possible breakout.


Cnooc Weekly Chart

Cnooc (0883) has broken out. Next resistance at 12.30 and thereafter 13.00.

Disclosure: Long in Petroch and Cnooc CW.

Sunday, October 11, 2009

Commodity Summary

Crude Oil Futures Daily Chart

Looks like a rising wedge pattern for crude oil. A buy triggered on the daily chart. This means that it should challenge the upper resistance at around 75.00.


Gold Futures Weekly Chart

That is definitely a breakout for gold! Weekly chart is not yet overbought. So, can expect some more gain. If you look at the monthly chart, this bubble can sure go a long way before it burst.

The summary for others:
Commodity Monthly Weekly Daily
Gold Up Up Up
Crude Oil Up Up (+) Up (+)
Crude Palm Oil Down Down Down
Rough Rice Neutral Neutral Neutral (+)

I have not put in other agriculture futures in the table above. Too lazy. But I should say that most of the agriculture futures have made a bullish divergence. So, watch out for agriculture plays in the future.

World Weekly Summary

SSECI Weekly Chart

Looks like SSECI has found a supporting uptrend line. Now, lets wait for the base building and see what happens next.

HSI Weekly Chart

HSI continues to move higher. Next strong resistance should be around 23,000.


S&P 500 Weekly Chart

S&P 500 should challenge the downtrend line soon. The resistance level is at around 1100.

The summary for the rest:
World Monthly Weekly Daily Note
S&P500 Up Up Up (+) R=1.12k, S=1.01k
DJI Up Up Up (+) R=10.1k.
NasdaqComp Up Up Up (+) R=2.18k
Nikkei 225 Up Neutral Neutral (+) Next R=11k
Kospi Up Up Neutral R=1.9k.
SSECI Up Neutral Neutral (+) R=3.5k. S=2.6k. Finding base.
HSI Up Up Up (+) R=23.5k, S=20k.
TWII Up Up Up R=7.9k. S=7k
STI Up Up Neutral R=2.7k. S-2.52k
JKSE Up Up Up R=2.5k. S=2.3k
SENSEX Up Up Neutral (-) R=17.6k
AORD Up Up Up (+) R=4.9k
NZX50 Up Up Up R=3.2k
FTSE Up Up Up (+) R=5.4k
DAX Up Up Up (+) R=6.15k
RTSI Up Up Up (+) R=1.25k
Bovespa Up Up Up R=66k

Friday, October 09, 2009

Gamuda

Gamuda Weekly Chart

Gamuda is making a symmetrical triangle pattern. Watch out for a possible breakout.

Disclosure: Long in CW.

Weekly Summary

KLCI Weekly Chart

Market is overbought once more. So, I guess the explanation for going up is that this is the pre-budget rally. Oh, whatever. I prefer to look at individual stocks to make my trading decision. Every sectors except ACE market, is up now.

Malaysia Monthly Weekly Daily Note
FBM KLCI Up Up Up (+) R=1.3k, S=1.15k. Overbought
Finance Up Up Up (+) R=11k, S=9.5k
Construction Up Up Up (+) R=250, S=220
Plantation Up Up Up (+) R=6.15k, S=5.8k
Property Up Up Up (+) R=820, S=760
FBM ACE Up Neutral Neutral Triangle pattern.

Next week, pay attention to the property sectors. IJMLand, Glomac, and recently BRDB have moved (I only monitor stocks with warrant). There may be some laggards left which have not make any substantial movement. I think that if the property index (chart below) can close above 800, then that can be the 1st signal to get a little bit more aggressive with property counters. If the property index closes above 820, I think we will see euphoria. Currently, I have IJMLand-WA, E&O-WA and BRDB-WA.

Property Sector Weekly Chart

Wynn Macau


What a hype with Wynn Macau (1128). The traders that bought Wynn-C1 and Wynn-C2 sure have a crystal ball. Wynn-C1 is trading at a 36% premium while Wynn-C2 is at 61% premium! These traders sure take a lot of risk. With a simple gearing of around 2.4, in my opinion, it does not worth buying at all.

Volume View Point

Chartist are complaining that this uptrend is moving up with lower volume. Well, I think that they are too obsessed with volume and they are reading it the wrong way.

First, they only refer to the volume for the whole market. But you need to remember, the information does not represents the whole market due to speculative play such as KNM that inflates the volume. Sometimes you can see that penny shares that are hotly traded that command the top-10 trading spots.

For me, observation of volume is better done for individual stocks and not on the general market. What you consider a healthy uptrend is when:
  1. Higher volume when moving up
  2. Lower (decreasing) volume when moving down
The last point is, we don't want too high volume. A big spike in volume, especially when the stock is already on a long uptrend, usually indicates the end of the trend. Very high volume indicates that ah-pek, ah-mah and everyone is in. That is when you want to stay out (or get out).

Best time to get in is during low volume (of course after your trading setup issue a buy). If you can do that, then consider yourself not one of them (ah-pek & ah-mah) anymore.

Thursday, October 08, 2009

BRDB

BRDB Weekly Chart

Immediate resistance at 1.82, next one at 2.30. Weekly chart is not yet overbought. Daily almost. Best way to play this is BRDB-WA which has broken the ascending triangle pattern. At today's closing BRDB-WA is not yet overbought and trading at -1.12% premium.

Disclosure: Long in BRDB-Wa.

Wynn Macau and HSI CW

3 new call warrants from CIMB will be listed on 9 Oct 2009:
New Warrants Expiration Type Ex Price Ratio
WYNN-C1 7/7/2010 Call HKD 10.0800 8 : 1
WYNN-C2 7/1/2011 Call HKD 12.8800 8 : 1
HSI-CB 30/11/2010 Call 21,000.00 8000 : 1

If you are from Bursa Malaysia, can you please ask Yusli to ensure that the warrant issuers include the stock code for the underlying stock of the SW? It is so troublesome to look for it. Wynn Macau stock code is 1128 and it is good if this code is included in the announcement template, just to prevent any misunderstanding.

Wednesday, October 07, 2009

Moneyness


So many warrants, how to choose? Once upon a time, there were only 1-2 call warrants per underlying stock. Now, times have changed, the list is getting longer. Every investment bank is busy issuing structured warrants.

I have just upgraded by Bursa Malaysia Warrant Calculator by using color coded rows to indicate the moneyness of the warrant. Green indicates in-the-money (ITM), pink indicates out-of-the-money (OTM) while gray indicates at-the-money (ATM). By using color codes, it is now easier to identify the moneyness of the warrant.

Don't understand ITM/OTM/ATM? Then check out here.

Genm, Sime Call Warrant

2 new CW from KIBB that will be listed on 8 Oct 2009:
New Warrants Expiration Type Ex Price Ratio
GENM-CN 6/10/2010 Call MYR 2.6500 4 : 1
SIME-CI 6/10/2010 Call MYR 8.0000 8 : 1

You can keep yourself up-to-date with the new warrants by using my Bursa Malaysia Warrant Calculator.

International Reserves of BNM

Date MYR (billion) USD (billion)
15-Sep-09 329.9 93.5
30-Sep-09 334.3 96.0

Monday, October 05, 2009

KNM

KNM Daily Chart

Based on daily chart, KNM could have broken out of a triangle formation. No buy signal yet. I think if it can at around 0.80, then only my system will issue a buy signal.


KNM Weekly Chart

Based on the weekly chart, if KNM can move up from here, then it has built a solid base which will enable it to challenge the downtrend line at 1.80-1.90.

There are 2 call warrants -CB/-CC. -CC gives you a better value as it is currently in the money. You can verify it using my Bursa Malaysia Warrant Calculator.

Disclosure: No positions.

Proton, Genting, Gens, HSI Call Warrants

More call warrants from CIMB that will be listed on 6 Oct 2009:
New Warrants Expiration Type Ex Price Ratio
PROTON-CB 4/10/2010 Call MYR 4.4000 5 : 1
GENTING-CQ 4/10/2010 Call MYR 7.0000 8 : 1
GENS-C3 4/10/2010 Call SGD 1.0800 4 : 1
HSI-CA 29/10/2010 Call 21,000.00 10000 : 1

Commodity Summary

Crude Oil Futures Weekly Chart

Crude oil still refuses to drop. It is clearly forming a ascending triangle and should challenge 75 again.

Gold Futures Weekly Chart

Gold moves up and down the 1000 level for the past few weeks. Will it moves up this time? My supporting evidence is the weekly RSI which is not yet overbought but shows a bullish reading. That is why I'm waiting for gold to move higher. The only problem is that it may not stay up high very long (based on daily chart reading).

The summary for the rest are:
Commodity Monthly Weekly Daily
Gold Up Up Up (+)
Crude Oil Up Neutral Neutral (+)
Crude Palm Oil Down (-) Down Down (-)
Rough Rice Neutral (-) Neutral Down

Saturday, October 03, 2009

World Weekly Summary

Correction everywhere. No sign of downtrend yet (based on monthly chart). Mixed signals from US, Europe and Asian markets.

World Monthly Weekly Daily Note
S&P500 Up Up Neutral R=1.12k, S=1.01k
DJI Up Up Neutral R=10.1k.
NasdaqComp Up Up Neutral R=2.18k
Nikkei 225 Up Neutral (-) Down (-) Next R=11k
Kospi Up Up Neutral (-) R=1.9k.
SSECI Up Neutral Down R=3.5k. S=2.6k. Finding base.
HSI Up Up Neutral R=23.5k, S=20k.
TWII Up Up Up (+) R=7.9k. S=7k
STI Up Up Neutral (-) R=2.7k. S-2.52k
JKSE Up Up Up R=2.5k. S=2.3k
SENSEX Up Up Up R=17.6k
AORD Up Up Neutral (-) R=4.9k
NZX50 Up Up Up (+) R=3.2k
FTSE Up Up Neutral R=5.4k
DAX Up Up Neutral R=6.15k
RTSI Up Up Neutral (-) R=1.25k
Bovespa Up Up Up R=66k