Ads
Wednesday, September 15, 2010
Interesting Charts: Construction
Salcon: May have broken it's downtrend line which was formed since listing day! This makes you wonder what type of IPO junk they throw to the retailer.
MRCB: Moving within a uptrend channel. Now almost at the upper-side of the channel.
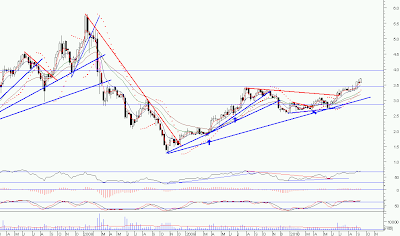
WCT: Consolidated for 14 months at the 2.50-2.80 range. A false break in April 2010. Is this for real now?
IJM: Looks like it has broken its downtrend line. The next one is the upper-side of a rising flag.
A close above 5.20 should allow it to zoom up to 6.40.
Gamuda: This is the leader in the construction sector. Next resistance is around 4.00.
Disclosure: Long in IJM and Salcon.
Labels:
Construction Stock
Subscribe to:
Post Comments (Atom)


No comments:
Post a Comment