At least got some comfort with Wellcall, Measat, Frontkn and Mems.
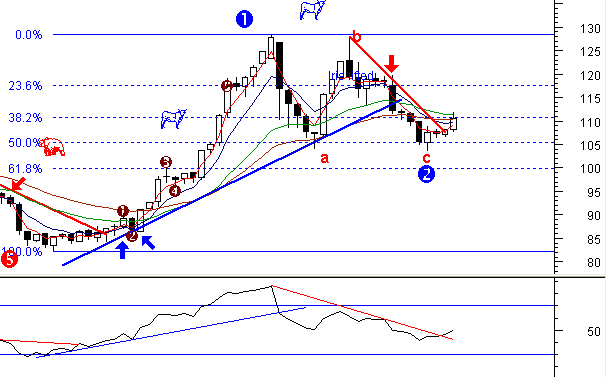
Is this a bull or what? Monthly chart shows KLCI got potential to break higher, I do not see any signs of trouble yet (but then again my bullish bias may effect my judgement) I read that many other analysis complaint about low volume, I think that is OK. Low volume means not everyone are convince yet. So, it should be OK to buy. High volume shows everyone is in (students with PTPTN money, auntie with wet market money, and retirees with life savings etc) Then that is the time to sit tight and watch. I always remind myself that professionals buy when everyone is not looking, and sells when everyone is buying. So need to think like the pros. Beside that, need to remember that in any bull move, the blues will move first (Commerze, Tenaga, Maybank), then the 2nd liners, then 3rd, 4th and so on.
I have stopped buying on breakout. Too many times get caught. Now buying during low volume. It's ok for me since my position is so small it won't "move" the market during low activity. Low means the stock has calm down after sudden burst of activity with the long term trend still pointing upwards.
Mesdaq: Weekly RSI hinted that the worse is over for Mesdaq.
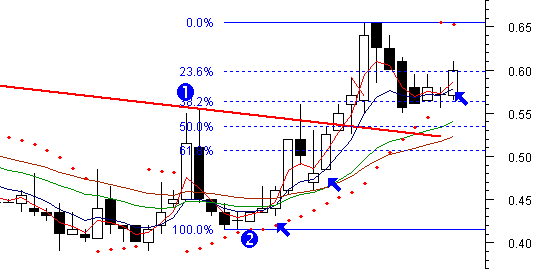
Coastal: Weekly EMA shows that it may be moving up again.
3 comments:
problem with buying on very low volume is you may end up holding the stock for a very long time.
Bought coastal at 59 sen 2 days ago. Now getting worried about the volume.
Both pullback and breakout entry work on condition that the entry is made when the long term trend is up and the set-up reward-to-risk ratio is at least 2:1. Trading in the direction of the trend gives positive expectancy.
I use 20-wk MA to determine the long term trend and 20-day MA to determine the intermediate term trend. When both 20-wk and 20-day MAs are pointing up then I wait for either pullback to support level (MA, trendline, price support and retracement) or consolidation patterns, e.g. triangles, flags, rectangles, wedges etc to form. Once price has pulled back to support, I wait for bullish reversal candles. Entry is on take-out of the high of the bullish reversal candles.
Entry on continuation patterns is either on breakout of the pattern upper line (the textbook method) or rebound of the pattern lower line. Entry on the latter method usually requires longer holding period but gives better reward-to-risk ratio.
Post a Comment